

Overview of July 2026 Temp Data And 12 Month Trends
12 Month Trends
| Annual Temperature Trend | |||
| Month | Average since 2007 | Current Month | Difference |
| January | 43.5°F | 45.6°F (2026) | 2.1°F |
| February | 49.5°F | 54.6°F (2026) | 5.1°F |
| March | 57.3°F | 65.4°F (2026) |
8.1°F |
| April | 64.8°F | 66.7°F (2026) | 1.9°F |
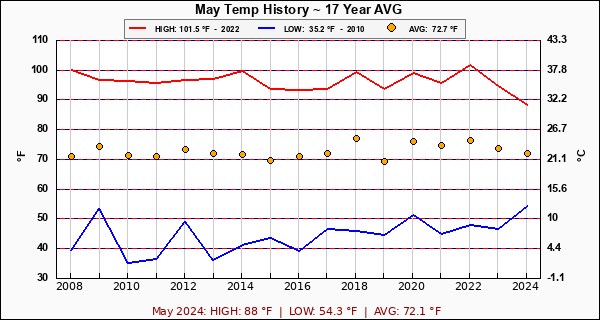
| May | 72.7°F | 73.9°F (2026) | 1.2°F |
| June | 82.9°F | 84.4°F (2026) | 1.5°F |
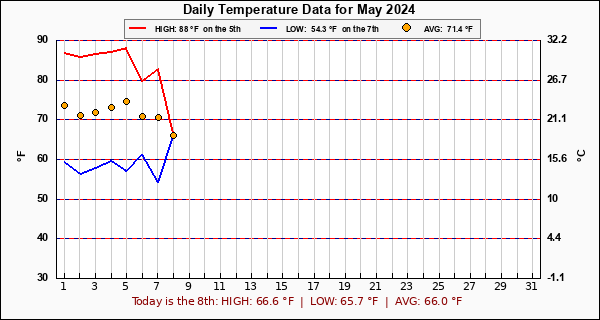
| ~ July ~ | 82.7°F | 84.6°F (2026) | 1.9°F |
| August | 81.3°F | 83.5°F (2025) | 2.2°F |
| September | 75.3°F | 75.9°F (2025) | 0.6°F |
| October | 65.1°F | 68.9°F (2025) | 3.8°F |
| November | 52.8°F | 57.1°F (2025) | 4.3°F |
| December | 45.0°F | 51.5°F (2025) | 6.5°F |
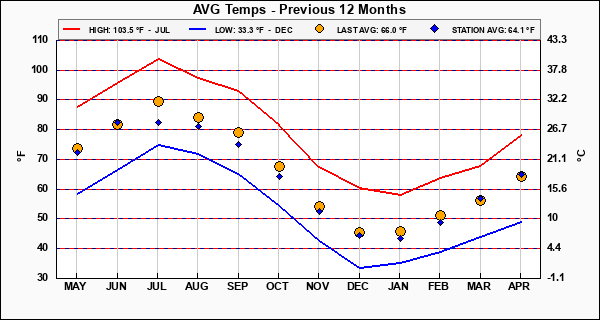
| Average 12 Month Temperature since April 3rd 2007: 64.4°F | |||
| Current 12 Month Temperature: 67.7°F | |||
|
Current 12 Month Temperature Trend: 3.3°F |
|||
| This table is reflective of 12 month trending at the Las Cruces Weather Station location. This is not official scientific data. | |||
Annual Trend Table script courtesy of: Michael Holden from www.relayweather.com
Graphs based on 'WxGraphs' by Stuart [broadstairs] using 'JPGraph'