

Overview of July 2026 Rain Data And 12 Month Trends
| Rainfall Data For July 2026 | |||
| Total Rain For The Month: 1.93 in | |||
| Days without Rain: 17 | |||
| Days with Rain: 8 (last - 7/24/2026) | |||
| Most Daily Rain: 1.35 in on day 19 | |||
| Days with 0.01 TO 0.09 inches Of Rain: 5 | |||
| Days with 0.10 TO 0.49 inches Of Rain: 2 | |||
| Days with 0.50 TO 0.99 inches Of Rain: 0 | |||
| Days with 1.00 TO 1.49 inches Of Rain: 1 |
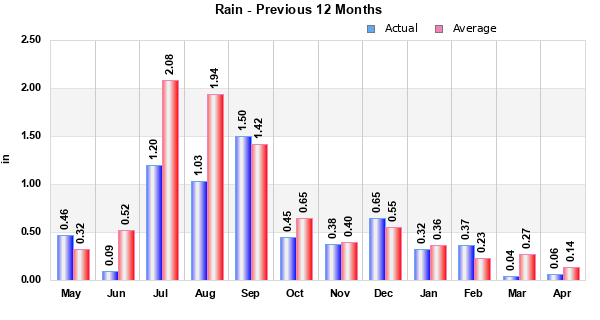
12 Month Trends
| Annual Rainfall Trend | |||
| Month | Average since 2007 | Current Month | Difference |
| January | 0.43 in | 1.87 in (2026) |
1.44 in |
| February | 0.21 in | 0.07 in (2026) |
-0.14 in |
| March | 0.25 in | 0.03 in (2026) |
-0.22 in |
| April | 0.12 in | 0.01 in (2026) |
-0.11 in |
| May | 0.31 in | 0.63 in (2026) |
0.32 in |
| June | 0.67 in | 1.69 in (2026) |
1.02 in |
| ~ July ~ | 2.10 in | 1.93 in (2026) |
-0.17 in |
| August | 1.78 in | 0.65 in (2025) |
-1.13 in |
| September | 1.41 in | 2.76 in (2025) |
1.35 in |
| October | 0.62 in | 0.50 in (2025) |
-0.12 in |
| November | 0.46 in | 0.69 in (2025) |
0.23 in |
| December | 0.51 in | 0.28 in (2025) |
-0.23 in |
| Average 12 Month Rainfall since April 3rd 2007: 8.87 in | |||
| Rainfall for last 12 months: 11.11 in | |||
|
Current 12 Month Rainfall difference:
2.24 in |
|||
| This table is reflective of 12 month trending at the LasCruces-Weather station location. This is not official scientific data. | |||
Annual Trend Table script courtesy of: Michael Holden from www.relayweather.com
Graphs based on 'WxGraphs' by Stuart [broadstairs] using 'JPGraph'
Monthly Rainfall Data Table created by LasCruces-Weather.com